A guide to choices, tradeoffs and candidates
What would a better city feel like?
A home you can afford to stay in. An easy trip across town. A street where you want to linger. A city that welcomes others, too.
This site is aimed at enabling policy that delivers the city we want.
The budget shows what we commit. Policy determines who benefits and who bears the costs. Candidates should explain how they would deliver, measure, and revise those choices.
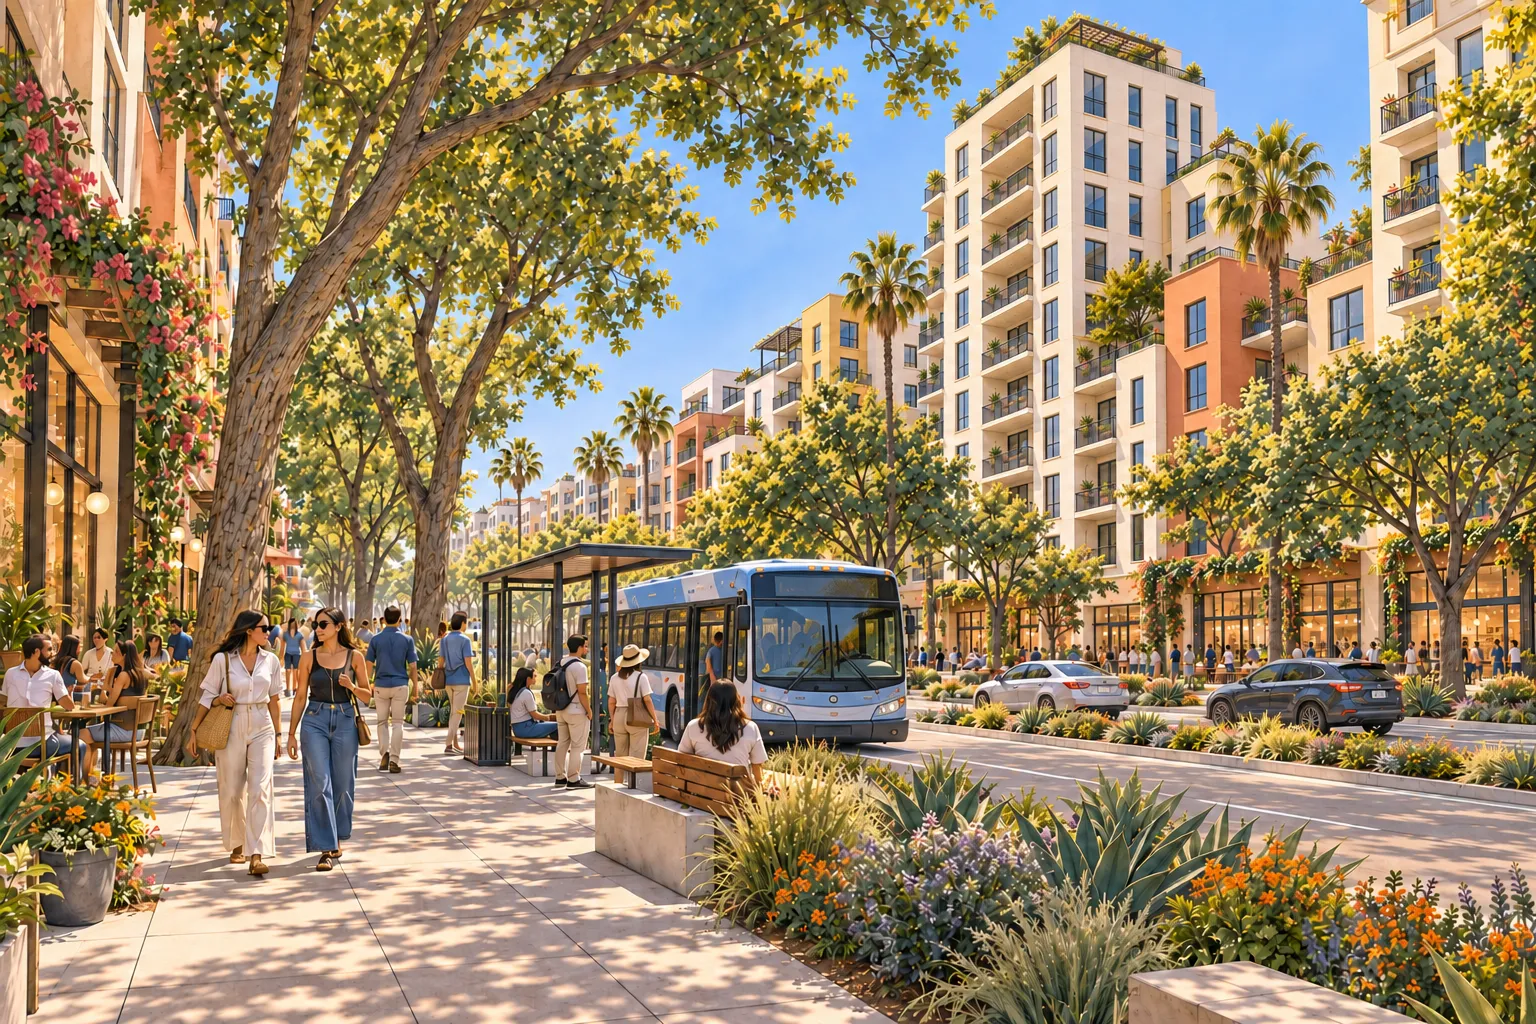
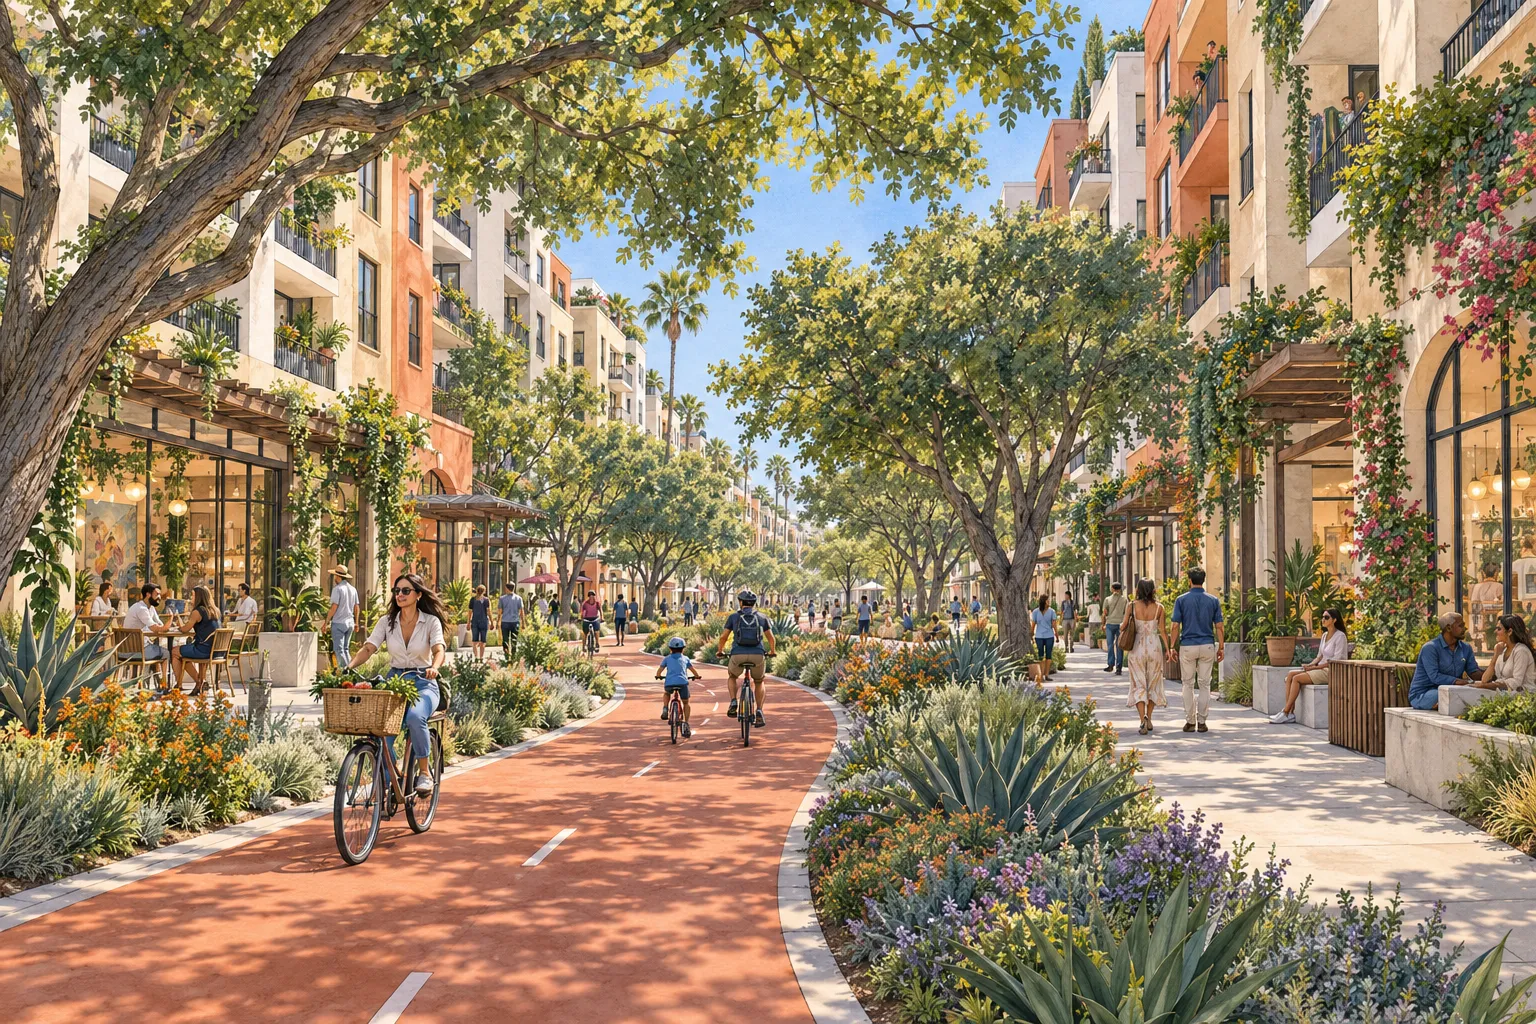
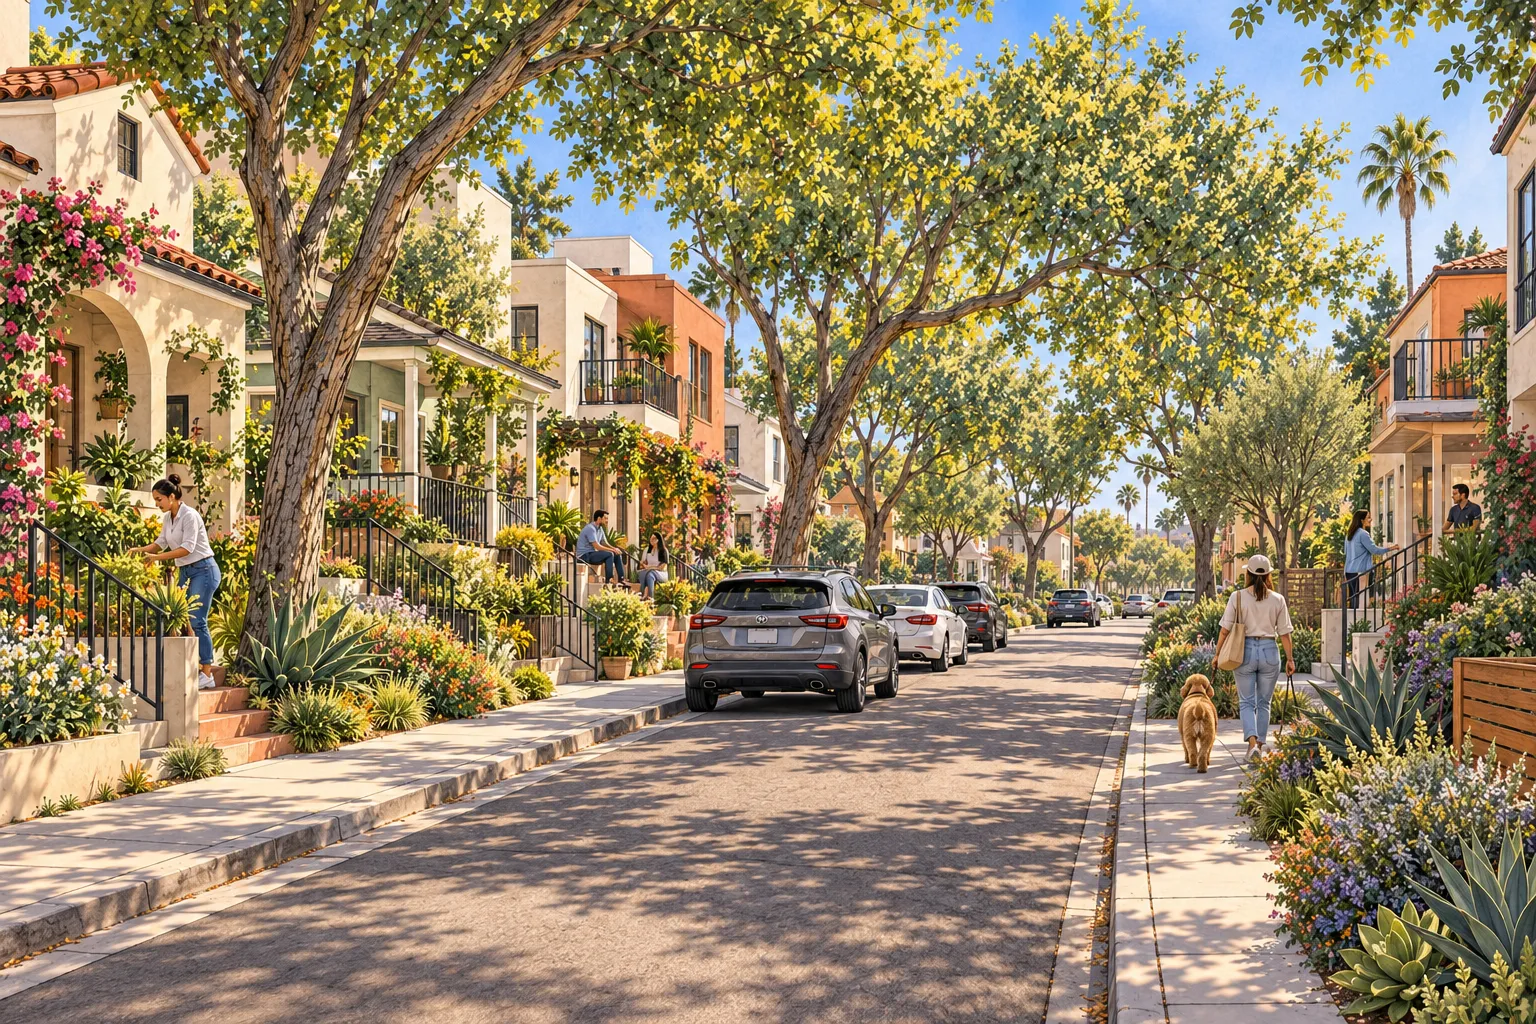
1What we value
Our starting point
We want Santa Monica to be affordable, safe, welcoming, and a place where people can build a life. Public policy can help accomplish this. Below, the three ways we evaluate policy and candidate positions:
These commitments lead to three questions: Are we using public resources well? Do our choices respect the people affected? What evidence would tell us to change course?
2Effective use of public resources · FY 2026-27
The budget shows where money goes. Results show whether it works.
Before the choices, the money. The city's General Fund pays for police, fire, streets, parks, libraries and most everyday services. About a quarter of it comes from residents, a quarter from visitors, and half from businesses and the city's own income.
The left side is our estimate of who ultimately pays. The right side is what the council adopted for this year.
- Residents $135M (26%)
- Visitors $120M (24%)
- Businesses $190M (37%)
- City's own income $57M (11%)
Adopted spending is larger than adopted revenue this year; the difference is covered by other sources, such as reserves, which city Finance is confirming. Capital projects are not shown.
Table view, with where each block is covered
| Who pays | Amount | Share of revenue |
|---|---|---|
| Renters, paid directly | $37M | 7% |
| Renters, via property tax in rent | $45M | 9% |
| Homeowners | $53M | 10% |
| Hotel guests | $90M | 18% |
| Day visitors | $30M | 6% |
| Businesses and their customers | $190M | 37% |
| Investments, rents, internal charges | $57M | 11% |
| Not assigned to a payer | $7.5M | 1% |
| What it buys | Amount | Includes | Covered in |
|---|---|---|---|
| Police | $153M | Police Department | Public safety and emergency response |
| Fire | $68.9M | Fire Department | Public safety and emergency response |
| Public Works | $77.3M | Public Works Department | Parks, libraries, culture, and public space; Getting around |
| Transportation | $19.9M | Santa Monica Department of Transportation, General Fund share (Big Blue Bus is budgeted in its own fund) | Getting around |
| Community Development | $19.6M | Community Development Department | Housing and homelessness; Local business and downtown |
| Housing & Human Services | $26.2M | Housing & Human Services Department | Housing and homelessness; Children, schools, and aging |
| Library | $14.1M | Library | Parks, libraries, culture, and public space |
| Recreation & Arts | $11.6M | Recreation & Arts Department | Parks, libraries, culture, and public space; Children, schools, and aging |
| City administration | $76.4M | City Council, City Manager, City Attorney, Records & Election Services, Finance, Human Resources, Information Services | City finances and accountability |
| Other citywide costs | $58.2M | Non-departmental transactions ($61,965,865) less interfund transfers ($3,722,319), as the budget reports them | City finances and accountability |
Sources: FY 2026-27 adopted budget addendum: General Fund revenue, printed pp. 4–5; FY 2026-27 adopted budget addendum: General Fund operating budget by department, printed p. 11; SM-Gov estimate of who pays, by revenue line, method below. How we estimated who pays.
The General Fund is about half of what the city budgets. The rest sits in separate funds for the bus system, water and sewers, the beach and pier, housing vouchers, and taxes voters dedicated to specific uses. Most of these funds are paid for by the people who use them, or by grants, so they are not a choice between, say, bus service and police.
Each fund shows operating spending (running services) and capital spending (building and repairing things) as the council adopted them.
$1.03 billion across 28 funds · $909M after $118M of reimbursements and transfers between funds
- General Fund taxes $545M (53%)
- Fees, fares and charges $343M (33%)
- Grants $39.7M (4%)
- Dedicated taxes $33.8M (3%)
- Internal charges $65.2M (6%)
Hatched: fleet and insurance charges that departments pay each other. Funds pay each other for services and move money between themselves, so adding every fund counts some dollars twice. The budget subtracts $117.6M of reimbursements and transfers to reach a citywide total of $908.8M. Blocks combine General Fund departments with other funds that pay for the same kind of thing. Our grouping, not the budget's. Operating and capital are both included.
Table view, with where each block is covered
| What it buys | Amount | Includes | Covered in |
|---|---|---|---|
| Police, fire and public safety | $222M | General Fund: Police; General Fund: Fire; Citizens Option for Public Safety | Public safety and emergency response |
| Transportation and Big Blue Bus | $161M | General Fund: Transportation; Big Blue Bus; Gas Tax; Local Return; SCAQMD AB 2766; Parking Authority | Getting around |
| Public Works | $77.3M | General Fund: Public Works | Parks, libraries, culture, and public space; Getting around |
| Water, sewers, stormwater and trash | $150M | Water; Wastewater; Stormwater; Resource Recovery & Recycling | City finances and accountability |
| Parks, beach, pier, libraries and arts | $68.5M | General Fund: Library; General Fund: Recreation & Arts; Beach Recreation; Pier; Cemetery | Parks, libraries, culture, and public space; Children, schools, and aging |
| Housing and human services | $59.5M | General Fund: Housing & Human Services; Housing Authority; Community Development Block Grants; Low/Mod Income Housing Asset | Housing and homelessness; Children, schools, and aging |
| Community Development | $19.6M | General Fund: Community Development | Housing and homelessness; Local business and downtown |
| Voter-dedicated programs | $22.3M | Measure GS; Clean Beaches & Ocean Parcel Tax | Housing and homelessness; City finances and accountability |
| City administration and citywide costs | $135M | General Fund: City administration; General Fund: Other citywide costs | City finances and accountability |
| Airport, grants and other | $26.5M | Airport; Miscellaneous Grants; Special Revenue Source; TORCA | City finances and accountability |
| General Fund capital projects | $19.9M | General Fund capital | City finances and accountability |
| Fleet and insurance (internal) | $65.2M | Vehicle Management; Self-insurance: workers' compensation; Self-insurance: liability; Self-insurance: risk management; Self-insurance: bus | City finances and accountability |
Every city fund: fund by fund (28 funds)
$1.03 billion across 28 funds · $908.8M after $117.6M of reimbursements and transfers between funds
- General Fund $545M (53%)
- Transit $129M (13%)
- Utilities and services paid by fees $150M (15%)
- Beach, Pier, Airport and Cemetery $63.5M (6.2%)
- Housing $33.3M (3.2%)
- Dedicated taxes and street money $34.5M (3.4%)
- Grants and other $5.7M (0.6%)
- Internal services $65.2M (6.4%)
General Fund · $545M
The flexible pool shown above: taxes pay for police, fire, streets, parks, libraries and most everyday services.
- General Fund $545M
Transit · $129M
Big Blue Bus runs on fares and transit grants, with its own budget.
- Big Blue Bus $129M
Utilities and services paid by fees · $150M
Water bills, sewer charges and trash fees pay for these. They are not funded by general taxes.
- Water $57.4M
- Resource Recovery & Recycling $48.3M
- Wastewater $31.4M
- Stormwater $13.2M
Beach, Pier, Airport and Cemetery · $63.5M
Visitor-facing and self-supporting operations, funded mainly by the fees and rents they earn.
- Beach Recreation $19.1M
- Pier $19.2M
- Airport $20.8M
- Cemetery $4.5M
Housing · $33.3M
Mostly federal rental-voucher money passed through the city.
- Housing Authority $31.7M
- Community Development Block Grants $1.2M
- Low/Mod Income Housing Asset $0.4M
Dedicated taxes and street money · $34.5M
Voter-approved taxes and state and county funds that can only be spent for set purposes.
- Measure GS $17.6M
- Local Return $6.2M
- Gas Tax $5.3M
- Clean Beaches & Ocean Parcel Tax $4.6M
- SCAQMD AB 2766 $0.5M
- Citizens Option for Public Safety $0.2M
Grants and other · $5.7M
Smaller grant and special-purpose funds.
- Miscellaneous Grants $4.7M
- Special Revenue Source $0.9M
- TORCA <$0.1M
- Parking Authority <$0.1M
Internal services · $65.2M
The city charges these funds to its own departments for vehicles and insurance, so the same dollars also appear inside other budgets.
- Vehicle Management $19.7M
- Self-insurance: workers' compensation $17.3M
- Self-insurance: liability $12.0M
- Self-insurance: risk management $9.9M
- Self-insurance: bus $6.3M
Operating Capital (lighter) · Funds pay each other for services and move money between themselves, so adding every fund counts some dollars twice. The budget subtracts $117.6M of reimbursements and transfers to reach a citywide total of $908.8M.
Table view of every fund
| Fund | Operating | Capital | Total | What it pays for | Covered in |
|---|---|---|---|---|---|
| General Fund General Fund | $525M | $19.9M | $545M | Everything in the chart above, plus $19.9M of capital projects. | Public safety and emergency response; Getting around; Housing and homelessness; Parks, libraries, culture, and public space; City finances and accountability |
| Big Blue Bus Transit | $110M | $19.0M | $129M | Bus operations and bus capital. | Getting around |
| Water Utilities and services paid by fees | $37.3M | $20.2M | $57.4M | Water supply and delivery. | City finances and accountability |
| Resource Recovery & Recycling Utilities and services paid by fees | $47.7M | $0.6M | $48.3M | Trash, recycling and street cleaning. | Parks, libraries, culture, and public space |
| Wastewater Utilities and services paid by fees | $20.3M | $11.1M | $31.4M | Sewers and treatment. | City finances and accountability |
| Stormwater Utilities and services paid by fees | $1.4M | $11.8M | $13.2M | Storm drains and runoff projects, mostly capital. | City finances and accountability |
| Beach Recreation Beach, Pier, Airport and Cemetery | $17.9M | $1.2M | $19.1M | Beach parking, lifeguards, beach maintenance and programs. | Parks, libraries, culture, and public space |
| Pier Beach, Pier, Airport and Cemetery | $12.5M | $6.7M | $19.2M | Santa Monica Pier operations and repairs. | Parks, libraries, culture, and public space; Local business and downtown |
| Airport Beach, Pier, Airport and Cemetery | $13.6M | $7.2M | $20.8M | Santa Monica Airport operations and property. | City finances and accountability |
| Cemetery Beach, Pier, Airport and Cemetery | $2.9M | $1.5M | $4.5M | Woodlawn Cemetery. | Parks, libraries, culture, and public space |
| Housing Authority Housing | $31.7M | <$0.1M | $31.7M | Federal rent vouchers and administration. | Housing and homelessness |
| Community Development Block Grants Housing | $0.4M | $0.8M | $1.2M | Federal grants for housing and neighborhood programs. | Housing and homelessness |
| Low/Mod Income Housing Asset Housing | $0.4M | <$0.1M | $0.4M | Former redevelopment housing assets. | Housing and homelessness |
| Measure GS Dedicated taxes and street money | $17.6M | <$0.1M | $17.6M | Voter-approved tax revenue restricted to the uses set in its measure. | Housing and homelessness; City finances and accountability |
| Local Return Dedicated taxes and street money | $1.4M | $4.8M | $6.2M | County transportation sales-tax return. | Getting around |
| Gas Tax Dedicated taxes and street money | $2.7M | $2.7M | $5.3M | State gas-tax money for streets. | Getting around |
| Clean Beaches & Ocean Parcel Tax Dedicated taxes and street money | $4.6M | <$0.1M | $4.6M | Parcel tax for urban runoff and ocean water quality. | Parks, libraries, culture, and public space |
| SCAQMD AB 2766 Dedicated taxes and street money | <$0.1M | $0.5M | $0.5M | Air-quality district money for clean transportation. | Getting around |
| Citizens Option for Public Safety Dedicated taxes and street money | $0.2M | <$0.1M | $0.2M | State public-safety grant. | Public safety and emergency response |
| Miscellaneous Grants Grants and other | $3.6M | $1.2M | $4.7M | Federal, state and other grants. | City finances and accountability |
| Special Revenue Source Grants and other | $-0.3M | $1.2M | $0.9M | Special-purpose revenue. | City finances and accountability |
| TORCA Grants and other | <$0.1M | <$0.1M | <$0.1M | Small special-purpose fund. | City finances and accountability |
| Parking Authority Grants and other | <$0.1M | <$0.1M | <$0.1M | Nominal budget. | Getting around |
| Vehicle Management Internal services | $19.7M | <$0.1M | $19.7M | City fleet. | City finances and accountability |
| Self-insurance: workers' compensation Internal services | $17.3M | <$0.1M | $17.3M | Injury claims for city employees. | City finances and accountability |
| Self-insurance: liability Internal services | $12.0M | <$0.1M | $12.0M | Liability claims against the city. | City finances and accountability |
| Self-insurance: risk management Internal services | $9.9M | <$0.1M | $9.9M | Administration of claims and risk. | City finances and accountability |
| Self-insurance: bus Internal services | $6.3M | <$0.1M | $6.3M | Bus liability claims. | Getting around |
| All funds, gross | $1.03 billion | Adds every fund | |||
| Less reimbursements and transfers | −$117.6M | Money one fund pays another | |||
| Citywide total | $908.8M | As the budget reports it |
Sources: FY 2026-27 adopted budget addendum: budget summary by fund, printed pp. 11–14. How we grouped the funds.
These totals show the city's commitments, not whether a service delivers lasting results. To judge value, we also need to ask who benefits, who bears costs outside the budget, and what changes for people.
3Dignity and care
A policy works only if it works for the people affected.
Costs and outcomes matter, but neither tells the whole story on its own. We ask whether a choice protects people's safety, agency and ability to build a life, including people it affects beyond those it means to help.
If a sidewalk is cleared, what would count as success?
A neighbor can use it again. That matters. To know whether homelessness has improved, we also need to know where the people who slept there went.
What would we need to know before judging?
Ask what help was offered, where people went, whether they stayed housed six and twelve months later, and the full cost, including repeat crises or costs shifted elsewhere. A clear sidewalk and a lasting home are different outcomes; neither measure alone settles the question.
Explore the seven policy areas
Each area explains the choices, the evidence, what the city has already decided, and how candidates' approaches compare. Three are published now. The other four are in progress.
Housing and homelessness
Helping people find and keep an affordable home, how much and where we build new homes and density, leave homelessness, and share public space with dignity.
Draft for review · draft candidate assessment Policy area 2Public safety and emergency response
Fewer harms, the right help when we call, and a city prepared for emergencies in a changing climate.
Draft for review · draft candidate assessment Policy area 3City finances and accountability
What the city spends, what it can change, and how we would know it worked.
Draft for review · draft candidate assessmentGetting around
Safe, affordable ways to reach everyday life, and what our travel choices mean for the environment.
Local business and downtown
A lively local economy that supports daily life and services.
Parks, libraries, culture, and public space
Public life and access across neighborhoods and incomes.
Children, schools, and aging
Belonging and support across ages.
Across policy areas Environment
Climate, clean water and beaches, shade, and preparedness, each covered where the choices are made.
Where the five environmental questions live
There is no separate environment page. Each environmental question sits with the choices that drive it, and each owning policy area assesses candidates on it.
| Subject | Covered in |
|---|---|
| Travel emissions, mode choice, transport electrification | Getting around (coming after launch) |
| Building energy, housing location, development impacts | Housing and homelessness |
| Clean beaches, habitat, stormwater, shade, airport open space | Parks, libraries, culture, and public space (coming after launch) |
| Water supply, reuse, utility investment, citywide climate reporting | City finances and accountability |
| Climate hazards and preparedness | Public safety and emergency response |
A candidate's promise is a starting point. The next question is whether their public case explains how the choice would work and how we would know.
4Evidence and willingness to learn
What do candidates' public cases let us judge?
Campaign sites and, for incumbents, council votes show what candidates have put on the public record. We look for a specific choice, a way to deliver it, its costs and authority, a measure of success, and evidence that could change the approach.
In the September 27 campaign-site review, 9 sites had at least one specific commitment, 2 had no specific commitment found, and 1 campaign site was not found. This describes the material available for review, not the candidates' ability or intentions. See what we reviewed.
The twelve candidates
Our assessments of each candidate are published after every campaign has had 72 hours to review them and respond. Until then, each profile shows the candidate's policy choices and the public evidence behind them.
Three council seats are on the ballot, so you can vote for up to three of these twelve candidates. Pick up to three as you read, then compare your three side by side. Your picks stay in this browser.
- Phil Brock Specific commitments found on reviewed site. Council votes reviewed
- Lindsay Davis Specific commitments found on reviewed site
- Eli Gill Specific commitments found on reviewed site
- Daniel Ivanov No specific commitments found on reviewed site
- Wade Kelley No campaign site found in September review
- Ericka Lesley Specific commitments found on reviewed site
- Brett Morrow Specific commitments found on reviewed site
- Lana Negrete Specific commitments found on reviewed site. Council votes reviewed
- Ashley Oelsen Specific commitments found on reviewed site
- Caroline Torosis No specific commitments found on reviewed site. Council votes reviewed
- Derrick Townsend Specific commitments found on reviewed site
- Doug Trussler Specific commitments found on reviewed site
Where do you stand? Explore the same policy choices and form your own view.